
Less hand holding.
More work with data.
Get students doing more with data and even basic statistics in your courses next semester.
Graph-Driven Hypothesis Tests
DataClassroom helps students select an appropriate statistical test based on the data figure.
Recommendations are provided with timely explanations to teach students the fundamental concepts. Learn more.
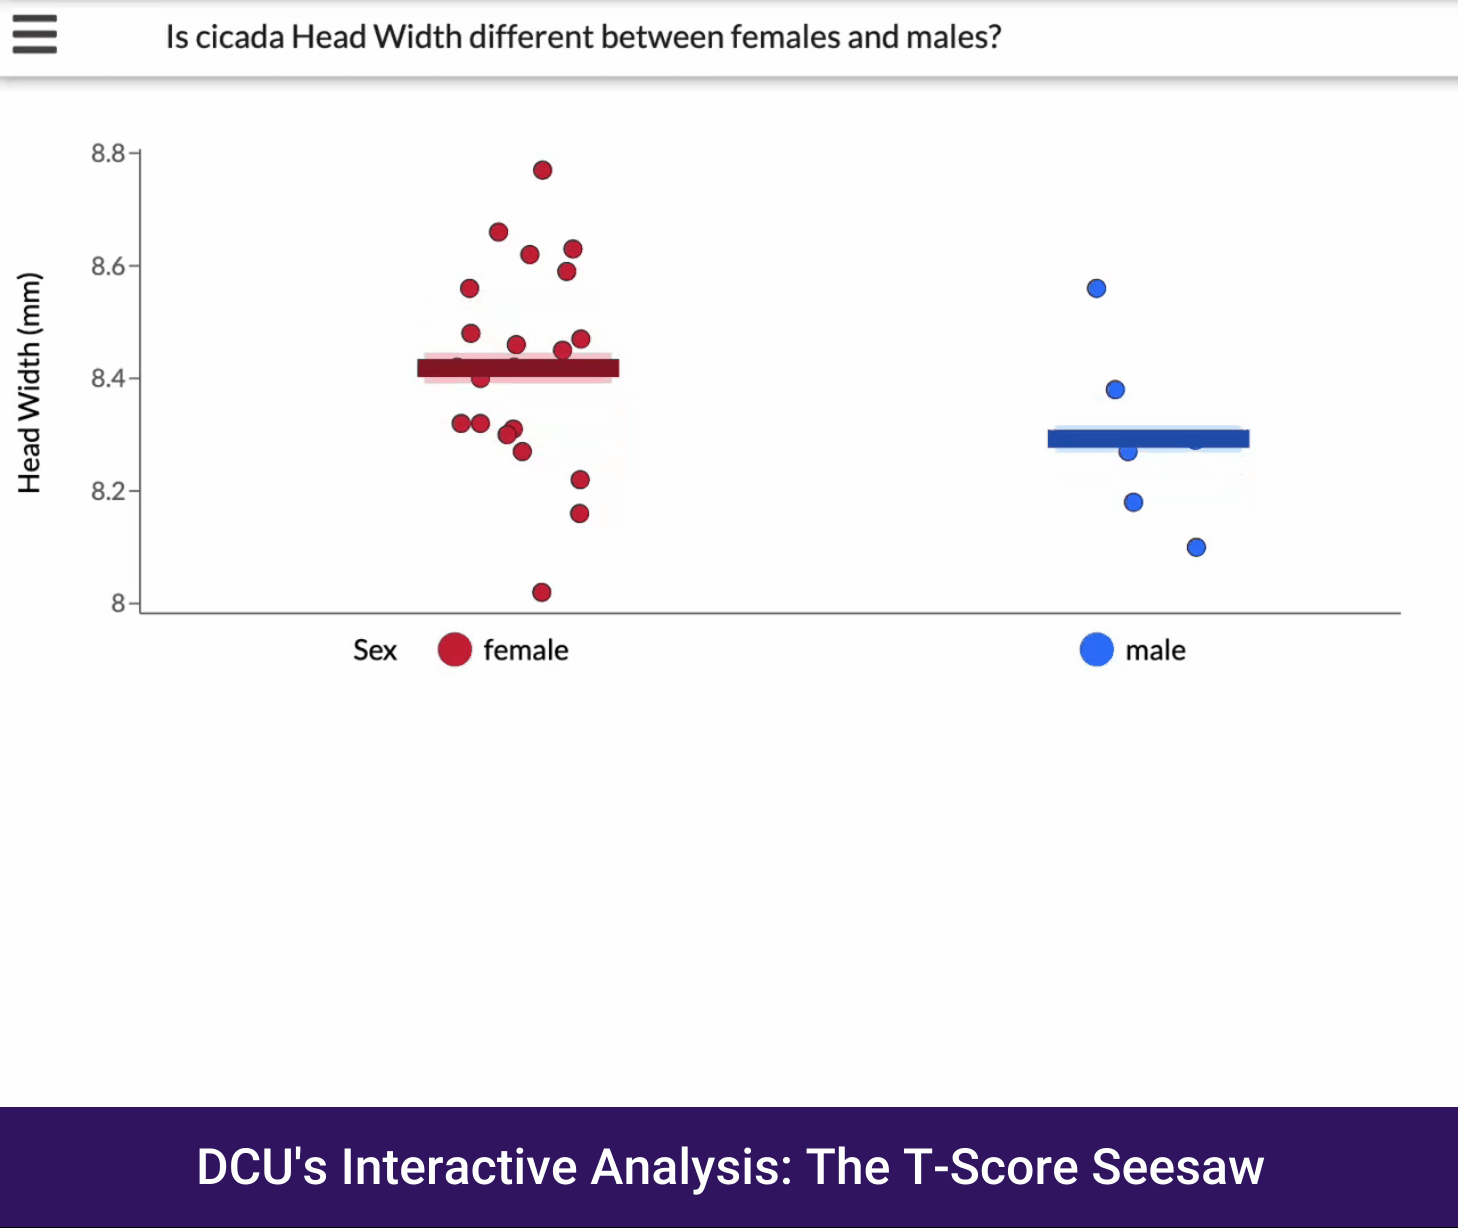
Interactive Analysis
These interactives take you through an animated explanation of the math and asks students to contribute and (yes!) think about what is happening. Learn more.
Bridges to R and Python
The built-in Bridge to R and Bridge to Python tools scaffold learning as students move from push-button graphing and stats to understanding and modifying their own scripts. Learn more.
Ready to talk about DataClassroom U for your course?
Join the growing collective of educators who are using DataClassroom U to create more engaging and effective learning experiences. Contact us to request a 20-30 minute demo and conversation.
DataClassroom U was built for learners.
Graphing
Create publication-quality graphs with our intuitive tools designed specifically for students. Customize colors, labels, jitter, trend lines and more.

Statistics
DataClassroom U supports students in selecting the appropriate statistical test based on the student’s choice of visualization and clearly explains why.

Data Analysis
Slice and filter your data, plot new variables, and toggle among graph types to bring the data to life.

What others are saying:
