

Plenty of tools can run a t-test. DataClassroom helps students actually understand what they're doing. No black boxes.
Its features keep students thinking, building real skills for the future.
Graph Driven Tests
T-tests, ANOVAs, chi-squares - picking the right statistical test can stop a science student cold . And the wrong choice sinks the analysis before it starts.
DataClassroom's Graph-Driven Tests flip the script: students build the graph they want, and based on the variables on each axis, the software suggests the tests that actually fit their data. Test selection becomes an extension of the visualization students already understand—so they spend their energy interpreting results, not second-guessing the setup.
Interactive Analysis
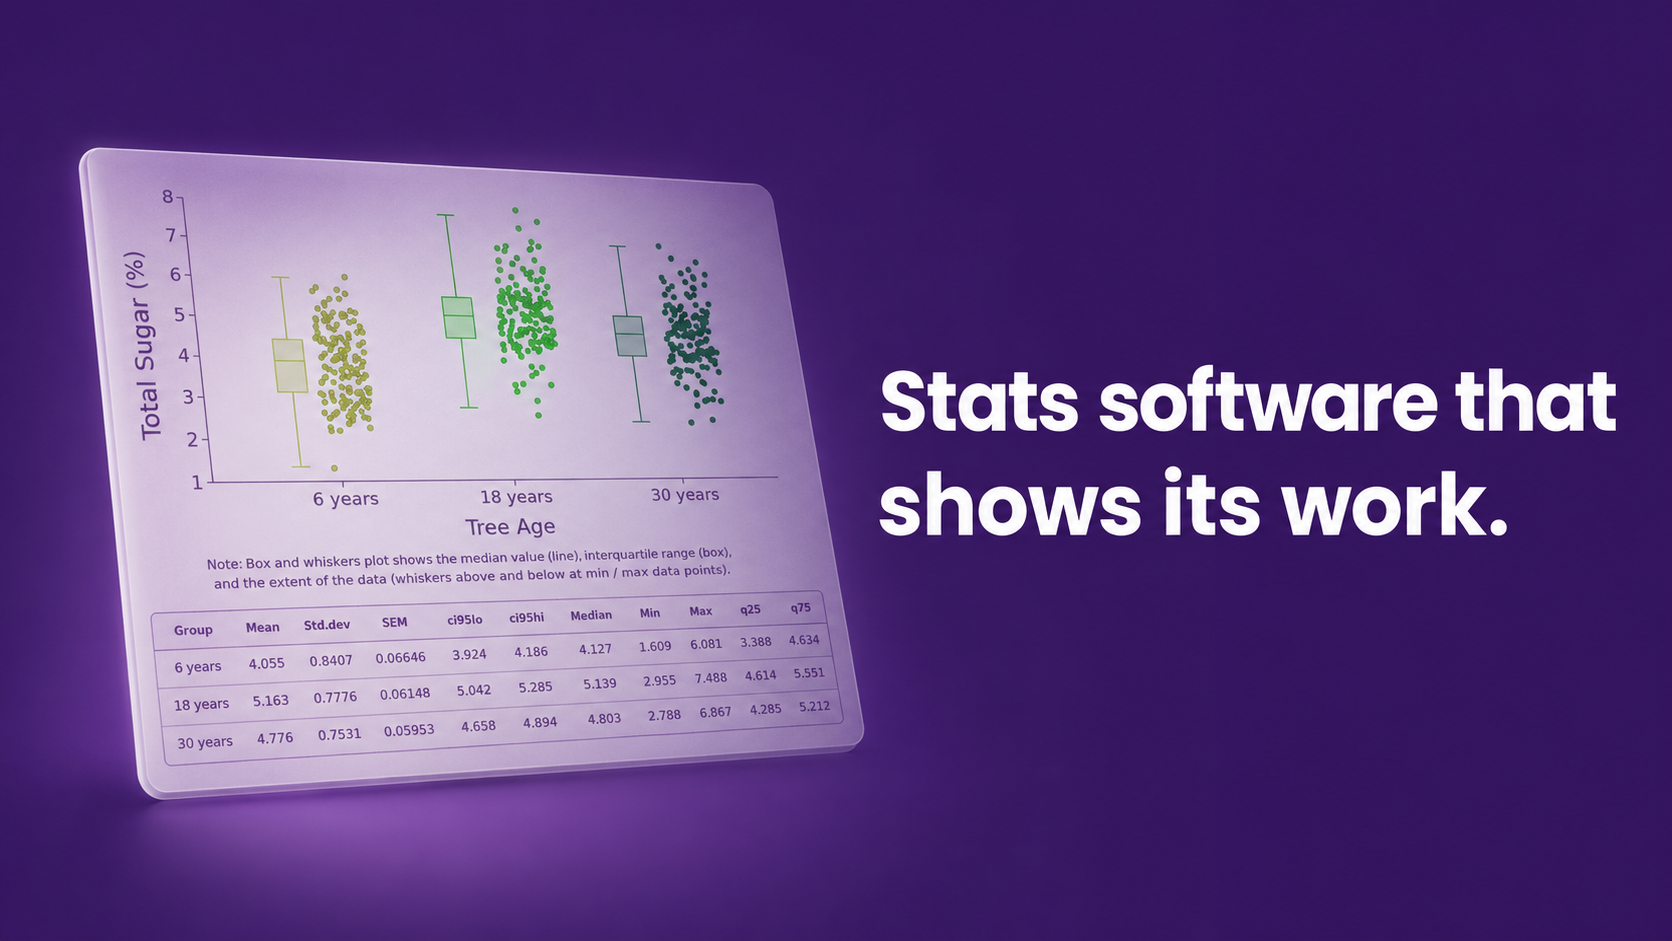
Most stats tools are black boxes—students drop in data, get a p-value, and learn nothing about what happened under the hood. DataClassroom's Interactive Analysis runs a fully accurate hypothesis test but walks students through a visualization of the math along the way, asking them to think and contribute at each step instead of passively waiting for an answer. It even writes up a polished Lab Notebook (downloadable as Word or PDF), so students come away understanding the reasoning—and with a finished report to show for it.
Bridge to R
R is where a lot of science students are headed, but the code can scare them off.
DataClassroom U's Bridge to R lets students run real analyses with a few clicks, then shows them the R code behind every chart and test—a friendly on-ramp that builds confidence while keeping them focused on their biology, chemistry, or ecology work.
Simulation Tool
Real experiments are slow, costly, and often impossible to run in class, so students rarely get a feel for how data actually behaves. DataClassroom's Simulation Models let students run virtual experiments at the click of a button—watching random variation unfold, testing what happens when a hypothesis is true or isn't, and seeing how results shift run to run. It's a low-stakes sandbox for building intuition about the concepts that trip students up most: sample size, confidence intervals, and p-values.
Resource Library
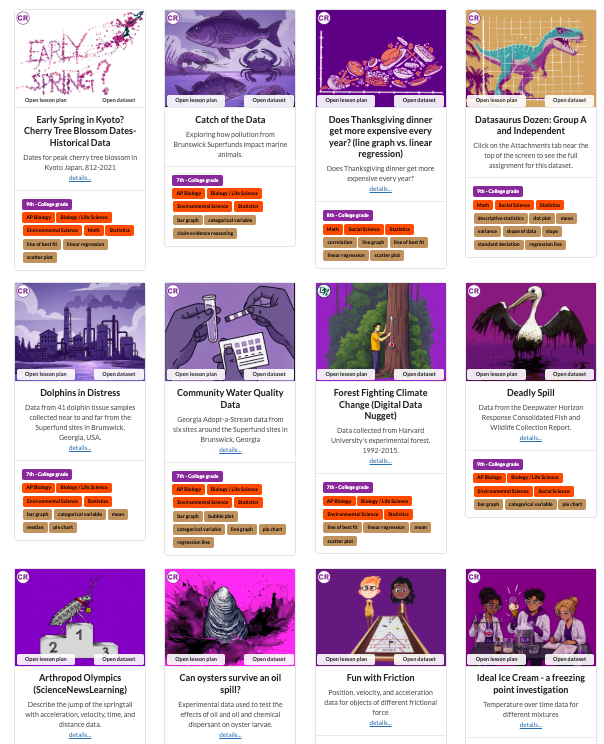
Building a solid data lesson from scratch is a time sink most instructors don't have to spare. DataClassroom's Resource Library hands you a searchable collection of free, classroom-ready lesson plans and real datasets—filterable by subject, concept, and grade level—spanning ecology, chemistry, physics, climate, and more. Each one comes ready to use with answer keys available on request, so you can drop a real-data investigation into your course without losing a weekend to prep.