
Online tools for graphing and statistics in the college classroom.
What do instructors say about it?
Learning data visualization and statistics can be a steep learning curve.
We can help.
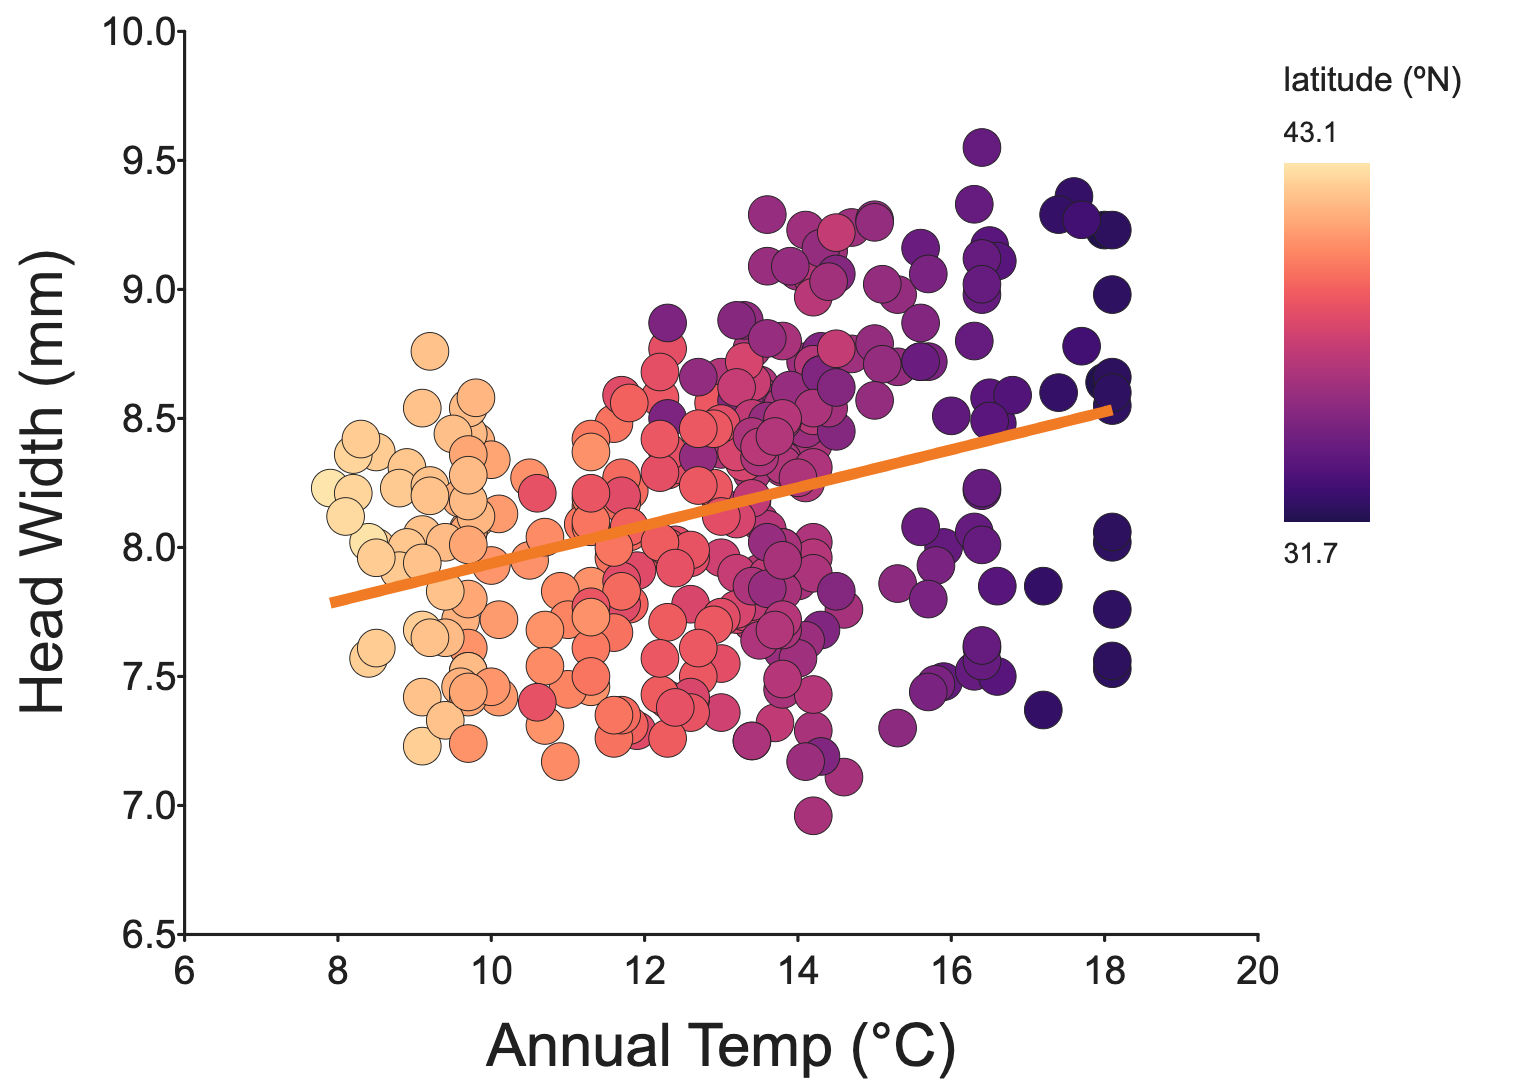
The graphing interface in DataClassroom U allows students to make publication quality graphs with just a few clicks.
Then, our intuitive and learning-focused analysis features assist in understanding how the data can be analyzed, and in performing statistical tests.

What is DataClassroom U?
DataClassroom U is a web-app for graphing, statistics, and data analysis in the college classroom.
It addresses the difficulties that can arise when teaching practical data and statistical skills in introductory science and statistics courses.
It has been pedagogically designed by a team with real-world experience in both teaching science and doing research, and refined by learning from the experiences of instructors and students.
Check out the features in our User Guide.
So does it make courses better?
We constantly hear from instructors and students how much benefit they have seen from moving to a purpose-built tool, as they save time, gain more understanding and engage more with their data. Here are some examples.
“It is encouraging us to do more with data because we know the students can handle it. Students are pretty comfortable and that takes away a lot of the stress.”
Dr. Jessamyn Manson, University of Virginia
“Using DataClassroom U was a fantastic way for students to be able to focus on data interpretation without having to worry about computer anxiety.”
Dr. Lauren Sullivan, Michigan State University
"It made the lab section much easier to teach, and the plots they generated were great."
Dr. Grover Brown, Jacksonville State University
“A fantastic active learning tool that allows students to see the real world application of what they are learning, WHILE exploring data analytics. Highly recommended!”
Dr. Abby Beatty, Auburn University

The built-in Bridge to R and Python Bridge scaffolds learning as students quickly move from push button graphing and stats to understanding and modifying their own scripts.
Learning to code and do stats at the same time can be intimidating.
It doesn’t have to be.

Curated datasets to get you started

Data literacy is key to solving the biggest problems of tomorrow.
Prepare your students today.


A tool that both:
assists and explains
to give
understanding and confidence